
How strong was the third-quarter earnings season?
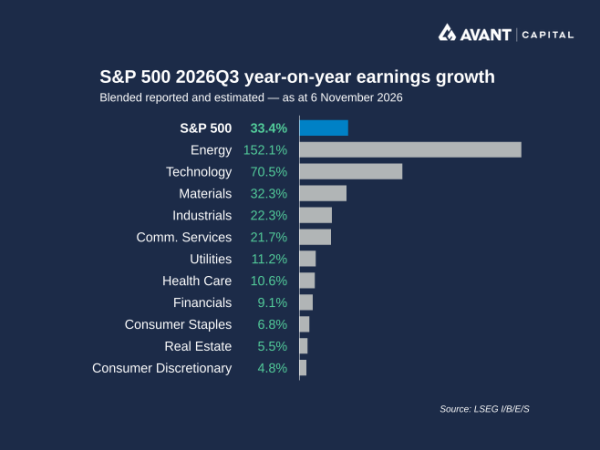
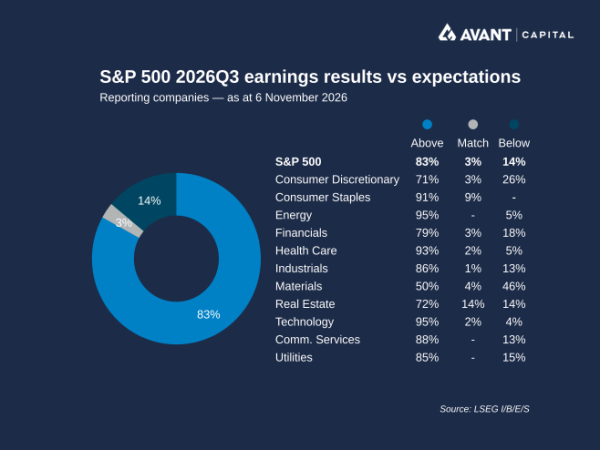
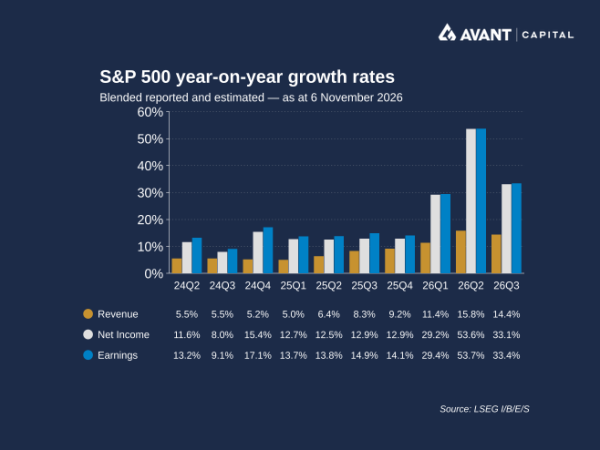
US companies delivered another impressive earnings season in the third quarter, but the response from investors was far less straightforward. Across the S&P 500, blended earnings growth reached 33.4% year on year1. With 435 companies having reported as of 6 November 2026, 83% exceeded analysts’ earnings expectations.
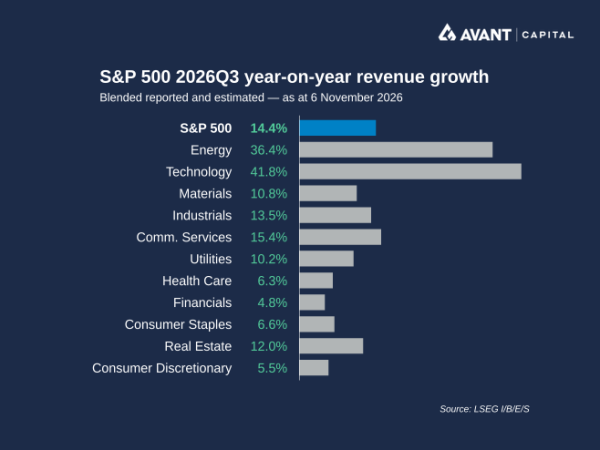
Revenue growth was also healthy at 14.4%, with 73% of reporting companies beating sales estimates.
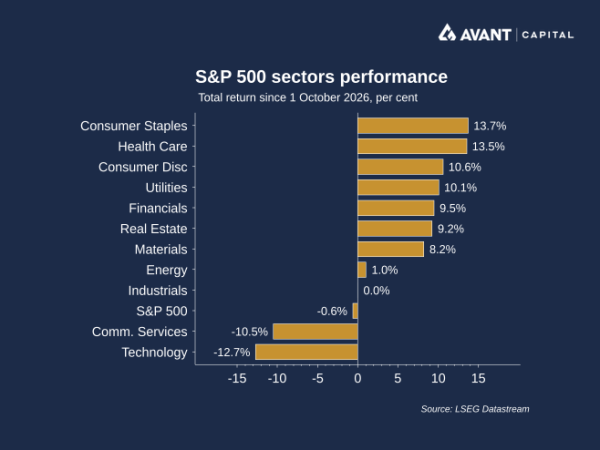
The figures describe a corporate sector that remained resilient despite higher interest rates, persistent inflation and uncertainty surrounding the durability of economic growth. Yet the season also showed that investors were becoming more selective. Strong headline earnings were no longer sufficient on their own. Companies were increasingly judged on the quality of their growth, the cash required to produce it and whether management could demonstrate a credible return on expanding investment.
Which sectors drove the earnings expansion?
Technology remained the largest contributor to the earnings picture, producing blended growth of 70.5% and revenue growth of 41.8%. Energy recorded an even larger earnings increase of 152.1%, driven by the Iran conflict keeping energy prices elevated. Materials earnings rose 32.3%, industrials increased 22.3% and communication services advanced 21.7%.
The breadth of growth was encouraging, with every major sector recording positive blended earnings growth. However, performance was uneven beneath the surface. Consumer discretionary earnings grew by 4.8%, while real estate increased by 5.5%. Financials delivered 9.1% earnings growth, supported by healthy trading activity, higher net interest income and relatively contained credit losses. The result was a strong aggregate season, but one still heavily influenced by technology, energy and other capital-intensive industries.
Why did artificial intelligence dominate the results?
Artificial intelligence was both the principal growth engine and the largest source of investor concern. Amazon, Meta, Microsoft and Google parent Alphabet collectively lifted quarterly capital expenditure to $US207 billion, compared with $US113 billion a year earlier2. Much of that spending was directed towards chips, data centres, energy capacity and the infrastructure required to train and operate increasingly sophisticated AI models.
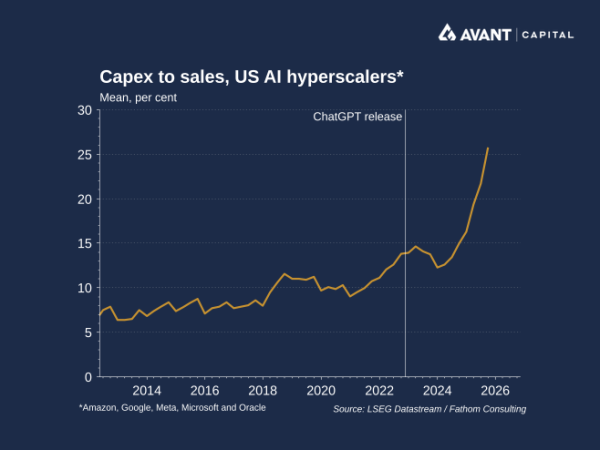
Cloud demand remained powerful. Amazon Web Services revenue rose 39% to $US46 billion3, while Microsoft Azure sales increased 48% to $US33.2 billion4. Google Cloud more than doubled its revenue to $US30.7 billion5. These numbers showed that demand for AI computing was genuine rather than hypothetical. Nevertheless, investors questioned whether even rapid cloud growth could justify the scale and speed of spending.
Why did cash flow matter more than revenue growth?
The sharpest market reactions were reserved for companies whose investment plans placed free cash flow under pressure. Amazon reported quarterly capital expenditure of $US75.8 billion and negative free cash flow of $US33.5 billion. Alphabet spent more than $US50 billion and recorded negative free cash flow of $US9.1 billion, only its second cash-burning quarter since becoming a public company. Meta also moved into negative free cash flow as it continued expanding its AI infrastructure.
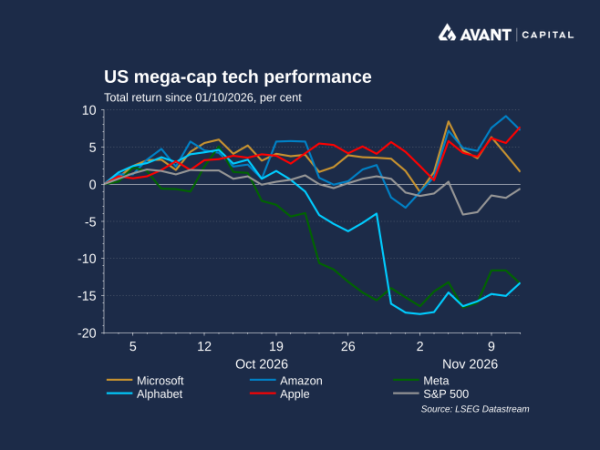
Microsoft stood apart by generating $US18.6 billion of free cash flow despite capital expenditure of $US45.2 billion. Its revenue rose 19% to $US92.3 billion and net income increased 32% to $US36.6 billion. Even so, questions remained about the composition and sustainability of its cash generation, particularly as leases, accrued expenditure and supplier financing become more important in funding data-centre expansion.
How did Wall Street’s banks perform?
The major US banks provided a contrast to the uncertainty surrounding Big Tech. JPMorgan Chase, Citigroup, Goldman Sachs and Wells Fargo all reported higher third-quarter net income than a year earlier. Equities trading was particularly strong, with revenue at Goldman Sachs increasing by more than 70% to $US6.4 billion and JPMorgan Chase recording an increase of almost 50% to $US5 billion6.
Fixed-income trading was less buoyant as higher rates weighed on credit and mortgage activity, but lending income remained supportive. Consumer spending also held up, while loan losses stayed comparatively restrained. These results suggested that the US economy was continuing to support corporate activity and household demand, even as investors debated whether trading revenues were approaching a cyclical peak.
What risks emerged outside the hyperscalers?
The effects of the AI infrastructure build-out extended well beyond cloud providers. Apple warned that unusually high memory-chip prices and the cost of operating AI services would weigh on margins. Although quarterly revenue reached $US114.5 billion and iPhone revenue rose 17%, the company forecast a gross margin of 45 to 46% for the following quarter, below market expectations7.
Physical constraints also became more visible. Data-centre projects faced delays involving electricity, land, equipment and planning approvals. These bottlenecks matter because they can postpone revenue while leaving companies committed to expensive chips, leases and financing arrangements. Smaller cloud infrastructure providers face an additional challenge because they often rely more heavily on debt and have less flexibility to absorb delays or cancellations.
What will investors watch next?
The third quarter demonstrated that corporate earnings remained resilient, but it also marked a change in what investors were prepared to reward. Attention is shifting from headline growth towards the quality and sustainability of earnings, particularly as companies commit increasing amounts of capital to artificial intelligence and supporting infrastructure.
The next phase of the earnings cycle will therefore be less about whether companies can spend heavily on AI and more about whether they can convert that investment into durable revenue, stronger margins and reliable cash generation. Corporate America continues to offer considerable growth, but the season made one point clear: the market’s tolerance for ambitious spending without visible financial returns is becoming considerably smaller.
References
- LSEG I/B/E/S, “S&P 500 earnings scorecard,” 6 November 2026
- Financial Times, “Big Tech sheds nearly $900bn in rout over soaring AI spending,” 30 October 2026
- Financial Times, “Amazon shares slide on lower Christmas sales forecast,” 30 October 2026
- Financial Times, “Microsoft blames data centre delays for lower capital expenditure,” 29 October 2026
- Financial Times, “Alphabet shares tumble in $500bn rout,” 29 October 2026
- Financial Times, “Wall Street plays down investor fears of faltering trading boom,” 14 October 2026
- Financial Times, “Apple warns ‘unprecedented’ memory chip costs will hit margins,” 3 November 2026