
The divergence between US and Australian equity market performance since the outbreak of the Iran conflict has been significant. While US equities have delivered exceptionally strong returns, Australian shares have lagged behind, leaving investors questioning whether this gap reflects cyclical forces, structural differences, or deeper policy and economic dynamics. The answer, as is often the case in markets, lies in a combination of earnings momentum, index composition, and macroeconomic settings.
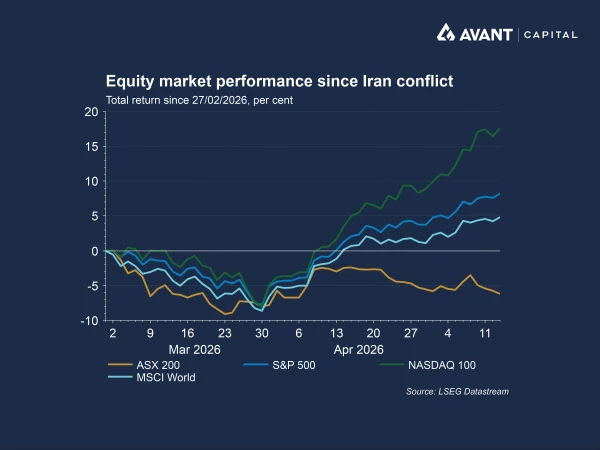
What has underpinned the powerful upswing in US equity returns?
US equity market gains in early 2026 have been overwhelmingly earnings-driven. The March quarter reporting season has delivered results that materially exceeded expectations, reinforcing confidence in corporate profitability despite geopolitical and inflationary headwinds. According to LSEG I/B/E/S, among the 88% of S&P 500 companies that have reported, more than 80% have beaten earnings expectations, while blended year‑on‑year earnings growth has exceeded 28%1. Technology and communication services stood out, with earnings growth significantly outpacing the broader market.
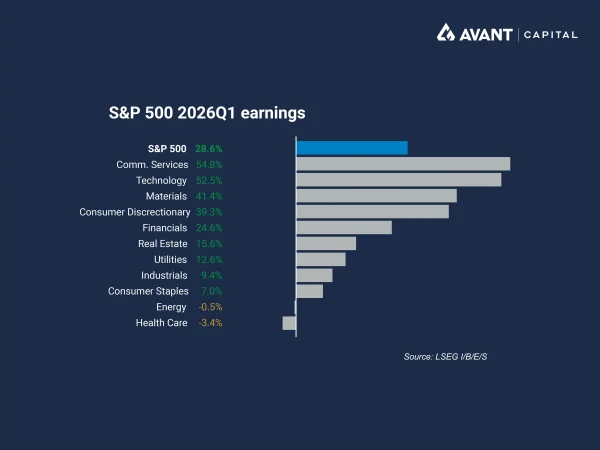
Crucially, this earnings strength has coincided with renewed optimism around artificial intelligence. US mega-cap technology firms continue to invest heavily in AI infrastructure, data centres and cloud computing, and are now translating that investment into revenue and profit growth. Big Tech hyperscalers have signalled capital expenditure of around $US725 billion this year, a figure 77% higher than last year’s record spending, reinforcing the perception that the US is at the centre of a global AI investment cycle2.
Why has market leadership in the US been so narrow?
While the headline index performance has been strong, the rally has been unusually concentrated. A small group of mega-cap technology stocks, including Nvidia, Alphabet, Amazon, Apple and Broadcom, has accounted for more than half of the S&P 500’s gains since early April. Measures of market breadth suggest the number of stocks meaningfully contributing to index performance has fallen to record lows3.
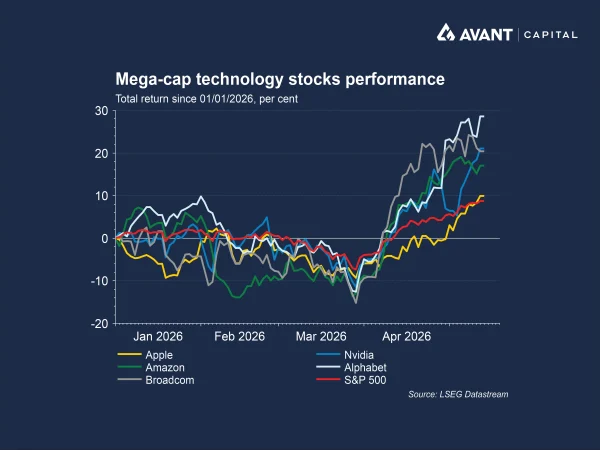
This narrow leadership is not incidental. Mega-cap technology companies represent a disproportionately large share of the S&P 500 by market capitalisation, meaning strong earnings growth in a handful of companies can drive index-level returns even if broader participation is limited. In effect, US equity indices are structurally designed to amplify the impact of mega-cap success, particularly in periods where technological change favours scale and capital intensity.
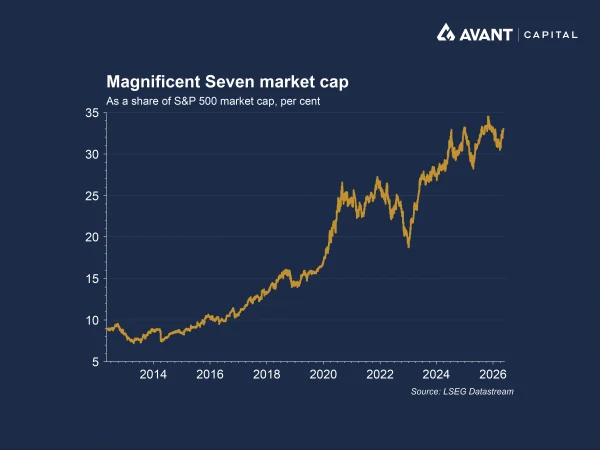
Why has Australia failed to keep pace?
Australia’s equity market tells a very different story. Rather than being heavily exposed to global technology leaders, the ASX remains concentrated in banks and resource companies, sectors that are inherently cyclical and far less exposed to the AI‑driven productivity gains reshaping large parts of the US economy. While US equity indices are increasingly dominated by technology and communication services companies with scalable earnings and structural growth tailwinds, Australia’s market is anchored to industries whose performance is closely tied to the domestic credit cycle, commodity prices and economic growth conditions.
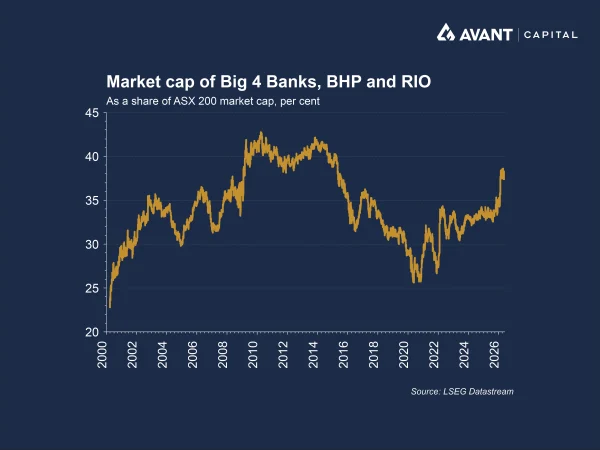
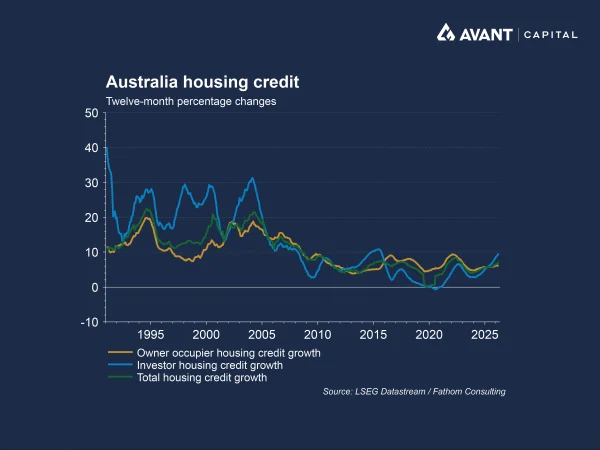
This concentration has been a headwind at a time when domestic economic conditions have tightened. The Reserve Bank of Australia has maintained a restrictive monetary policy stance amid above‑target inflation, compounded by global energy pressures linked to the Iran conflict, placing pressure on household consumption, housing activity and credit growth. Banks, which dominate the index, are particularly exposed to this slowdown, especially as higher interest rates coincide with weakening housing momentum.
How have recent policy changes compounded these challenges?
Recent federal budget measures have further weighed on sentiment. Proposed changes to capital gains tax and negative gearing significantly alter incentives across the economy. Analysis published in the Australian Financial Review suggests Australia may soon become one of the highest‑taxing developed markets for capital gains, reducing its attractiveness for capital‑growth investing while remaining highly favourable for dividend income4.
These changes risk encouraging companies to return more capital to shareholders via dividends rather than reinvesting in growth opportunities, potentially undermining long‑term productivity and business investment. For banks, the curtailment of negative gearing and the outlook for weaker housing credit growth have materially weakened earnings expectations, a dynamic reflected in Commonwealth Bank of Australia (ASX:CBA)’s more than 10% share price decline following budget night5.
Is productivity the real fault line between the two markets?
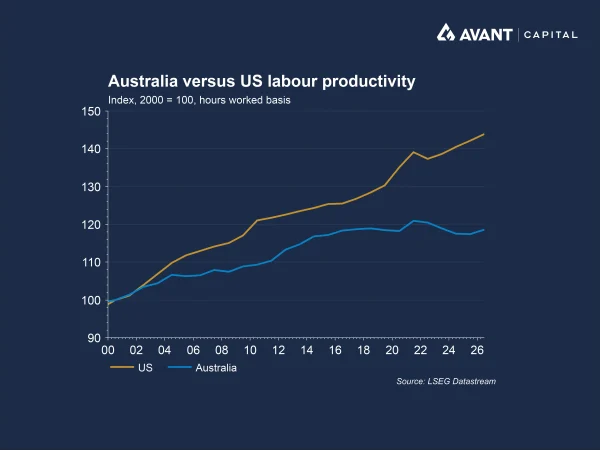
Beyond sector composition and tax policy, productivity trends represent a deeper structural driver of divergence. The US is aggressively harnessing artificial intelligence to boost efficiency, scale output and offset labour constraints. While AI investment is capital‑intensive and may add to inflation pressures in the near term, it offers a credible pathway to higher trend productivity growth over time. Australia faces a more complex transition. Industrial relations settings, skills shortages and infrastructure constraints risk slowing the diffusion of productivity‑enhancing technologies, limiting the economy’s ability to capture similar gains.
How do energy and geopolitics feed into the divergence?
The ongoing conflict involving Iran has exposed vulnerabilities in global energy markets. The International Energy Agency has warned that global oil inventories are being depleted at a record pace, heightening the risk of further price spikes should disruptions persist6. Australia is heavily dependent on oil imports and is one of the world’s most diesel‑intensive economies, reflecting the scale of its mining, transport and agricultural sectors. This leaves the Australian economy particularly exposed to higher diesel prices and energy‑driven cost pressures.
In the US, recent inflation data show energy costs feeding back into headline inflation, complicating the Federal Reserve’s path towards interest‑rate cuts. Despite this, US equities have risen to record highs. This reflects market composition, with large US technology and communication services companies exhibiting earnings profiles that are less directly tied to energy prices and domestic economic conditions than Australia’s more capital‑intensive sectors.
What does this divergence ultimately tell us?
The performance gap between US and Australian equities is not simply a cyclical anomaly. It reflects deep structural differences in index composition, exposure to transformative technologies, policy settings and productivity trajectories. While US markets are being propelled by a narrow but powerful engine of AI-driven earnings growth, Australia’s market is constrained by its reliance on banks and miners, tightening domestic policy and incentives that increasingly favour income over innovation.
References
- LSEG I/B/E/S, “S&P 500 earnings scorecard,” 8 May 2026
- Financial Times, “US stocks hit record highs in Wall Street’s best month since 2020,” 14 May 2026
- Financial Times, “Chart of the week: The narrow ceasefire rally,” 9 May 2026
- The Australian Financial Review, “Capital gains tax to be among highest in world,” 11 May 2026
- The Australian Financial Review, “Budget blow, profit miss and bad debt fears slice $30b from CBA,” 13 May 2026
- Financial Times, “IEA warns of further ‘price spikes’ as oil inventories plunge at record pace,” 13 May 2026